Is private health insurance too complicated?
When premiums increase, does the “shop around” remedy work?

Private Health Insurance (PHI) premiums increased on 1 April. Every time this happens, consumers are often advised to shop around.
But is this just putting responsibility on individuals to understand an incomprehensible system with thousands of different plans? Can an everyday consumer find one that is right for them, or will they pay the consequences if they make the wrong choice?
This is not to suggest that PHI isn’t important, as our recent PHI report showed, seniors value what PHI can offer, both in peace of mind and control. But can anyone realistically make a comparison and end up on the best deal under the system we currently have?
How complicated is the Private Health Insurance system?
Let’s start with prices.
The recent increase in prices for PHI, which occurs every year on 1 April (April Fool’s Day!) gives us insight into the complexity of PHI.
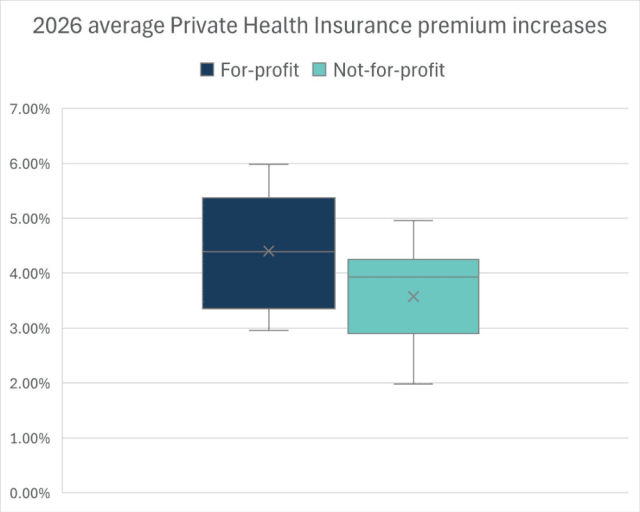
While the average increase across the whole sector is 4.41% (the highest since 2017), there is a wide range of variation between funds and between product tiers.
On average, premiums increased more among for-profit funds compared to not-for-profit funds in 2026.
What's in a name?
The Basic-Bronze-Silver-Gold labelling was intended to make it easier for consumers to compare what different plans offer in terms of hospital cover. Interventions are classified into clinical categories with each tier offering an increasing number of clinical categories as the minimum coverage (insurers can offer more than the minimum).
Gold covers every clinical category as a minimum, meaning you get access to all services.
Silver covers 26 out of the 38 clinical categories as a minimum – if you want hospital joint replacement to be covered, you need to go for gold.
Bronze covers 18 out of the 38 clinical categories as a minimum – if you need dental surgery, you may have to opt for silver or gold.
Basic covers no clinical categories as a minimum with all as optional, so you’ll have to read the fine print.
Plus. To make it more complicated insurers can label products as "Plus”, which indicates a plan includes additional coverage above the minimum number of clinical categories in a specific tier. Again, you will need to read the fine print.
Adding extra terms is undermining consumers’ ability to compare. For example, all of the current Medibank plans are called "Plus”, they also add either "Select”, “Value”, “Support”, or “Core” to this labelling further confusing the consumer.
PrivateHealth.gov.au, the government comparison website, lists almost 30,000 available hospital-only plans available across the country, let alone the closed plans, general health, and combined plans.
Some of the plans with the longest names include:
Corporate Essentials Silver Hospital with $500 Excess (Single Parent)
Suncorp Health Insurance Silver Advantage Hospital Plus $750 Excess
Lite Bronze Hospital Plus $500/$1000 Excess & Ambulance Care
Essential Silver Hospital $750/$1500 Excess & Ambulance Care.
Can even an informed consumer tell if Lite Bronze with Hospital Plus is better than Essential Silver with Hospital, before even considering the value of different excesses?
Confused? Join our Health Costs campaign to support our work to simplify the health system.
However, this average does not reflect the actual prices people see. This is because it takes the average across all the different types of plans: Basic, Bronze, Silver, and Gold.
The largest PHI insurer in Australia is Medibank, with 26.5% of the market. Its average increase in 2026 is 5.10%. But none of its individual plans are increasing by this amount: the lowest increase is Medibank’s Silver Plus Core plan, increasing by 1.89%; the highest is the Gold Protect increasing by 9.93%. Though this also varies by state, extras, discounts, and rebate applicable.
This is a trend seen across insurers; the plans with the highest level of cover increase the most, but the average is brought down by smaller price increases – or, in some years, price decreases – among the plans with lower levels of coverage.
Interestingly, there has been a trend in recent years of a declining number of insurers offering the highest-level Gold plans. Some insurers now only offer up to Silver!
The price of coverage is certainly one consideration but should be in the context of the amount and quality of the coverage.
Enter the Commonwealth Ombudsman
A recently released report by the Commonwealth Ombudsman found there is wide variation in the proportion of premiums paid out in benefits and the amount spent on management expenses.
For insurers with open membership (some funds are restricted to certain professions), the total benefits paid as a proportion of contributions made ranged from 75.4% (bad) to 90.4% (good, but not great). Put another way, that means for every dollar you pay, you get back between 75.4c and 90.4c in benefits on average in these funds.
Another interesting indicator is the proportion of income that a fund spends on “management expenses”, which ranged from as low as 7.6% up to 22.8% for open membership funds (not including one outlier fund with exceedingly high management expenses). So, for every dollar of income, funds spent between 7.6c and 22.8c on management related expenses – quite a wide variance.
The report also includes data on the proportion of hospital charges covered by a fund. In theory, if a fund paid a higher proportion of the hospital charges that would be good, right? The report found there was a wide variance in the amount that each fund would pay out for hospital stays – between 79.4% (bad) and 93.8% (better) on a nationwide basis.
Now, one might think, aha! I can use information about which fund is paying out:
the most of benefits paid overall;
the most for hospital; and
the least on management expenses
to easily see which one is the best.
Well, maybe not.
As the table below shows, this information does not lend itself to easy comparison and is only the average for each fund, not the individual plan.
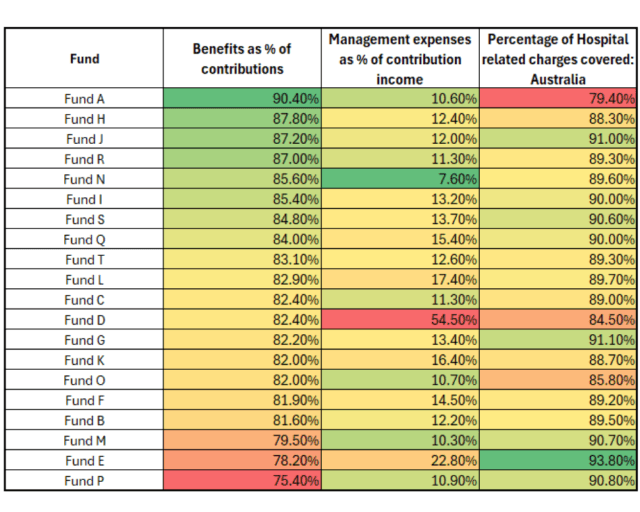
Source: Table based on data in Commonwealth Ombudsman: State of the Health Funds Report 2024-25 Note: we have chosen to de-identify the funds to avoid confusing consumers even more.
What the Ombudsman report shows is that there isn’t a clear link between hospital benefits, management expenses, and proportion of hospital charges covered.
The fund paying the highest proportion of hospital benefits (93.8%) has the second-highest proportional spend on management expenses (22.8%) and the second lowest benefits paid as a proportion of contributions (78.2%).
Meanwhile, the fund paying the lowest proportion of hospital benefits (79.4%) has fairly low management expenses (10.6%) and the highest benefits paid as a proportion of contributions (90.4%).
No payment gap to the rescue?
Another consideration for consumers when assessing a policy is the agreements insurers have with hospitals to ensure no payment gap. This is often used in marketing to signal a good deal.
According to the Commonwealth Ombudsman, “Known gap schemes are an arrangement where the insurer pays an additional benefit on the understanding that any fee charged by the medical provider is lower than the limit set by the insurer. For example, the insurer may limit the provider to charging a gap fee to the consumer of no more than $300.”
ACT has the lowest percentage of services with a no gap/known gap payment, at 91.4% (including restricted funds), while SA was the highest at 99.2%.
Interestingly, the fund that had the highest benefits paid (good) was also tied for the lowest percentage of services with a no gap/known gap arrangement (bad).
So, while it may seem better to go with an insurer that is paying out more in benefits, if insurers do not have agreements to keep out-of-pocket gap fees down, this might not be such a great deal.
Confused? Well, you should be. Complexity, unfortunately, is allowed within the PHI legislation.

What can you do?
There is no one simple metric to assess PHI; it’s a hugely complicated industry with so many different factors (see the breakout for more details). Each statistic reveals a different aspect, but not the whole picture.
It doesn’t have to be that way.
When prices increase for products with complicated pricing and benefit structures, consumers are told to “shop around”.
Consumers are often blamed for not shopping around for a better deal when the reality is that they cannot easily understand the intricacies of these complex products.
Rather than blame consumers, the system should be made simpler.
This is why NSA is calling for a comprehensive inquiry into the private health sector by the Productivity Commission, including private health insurance and specialist fees.
If you want to support our advocacy in this important area, join our Health Costs campaign or become a member of NSA.
Related Reading: Private Health 1, Private Health 2, ABC News 1, ABC News 2, Australian Government Department of Health, Disability and Ageing 1, Australian Government Department of Health, Disability and Ageing 2, Commonwealth Ombudsman


Thousands of Australia-wide discounts
Exclusive offers and savings across dining, shopping, gift cards, and more – all in the EAT | PLAY | SAVE app.

Members save 10% on Travel Insurance*
National Seniors members receive a 10% discount on travel insurance policies*.

Financial Information Consultant
Speak to a real person and receive up-to-date information on retirement planning, superannuation, and more!

Branches
Expand your social circle, enjoy social events, day trips, guest speakers, and meet like-minded members.

Exclusive Travel Discounts
Save on tours, cruises, and holidays with exclusive discounts on National Seniors Travel.

Our Generation Digital Magazine
Receive a yearly subscription to Our Generation Digital Magazine.

The Good Guys Commercial
Members enjoy exclusive access to The Good Guys Corporate Benefits. Save on small and large appliances as well as technology.

Advocacy & Research
Your membership directly funds our advocacy and research work fighting issues that affect you.

Competitions
Access exclusive member-only weekly competitions including books, DVDs, CDs, movie tickets and more.

Discounts
In addition to the discounts app, members can save thousands on eGift Cards and other discounted products.
*The discount applies to the total National Seniors travel insurance premium and is for National Seniors Australia members only. Discounts do not apply to the rate of GST and stamp duty or any changes you make to the policy. nib has the discretion to withdraw or amend this discount offer at any time. This discount cannot be used in conjunction with any other promotional offer or discount. ^ Cover is subject to terms, conditions, limitations and exclusions in the PDS.
National Seniors Australia Ltd ABN 89 050 523 003, AR 282736 is an authorised representative of nib Travel Services (Australia) Pty Ltd (nib), ABN 81 115 932 173, AFSL 308461 and act as nib's agent and not as your agent. This is general advice only. Before you buy, you should consider your needs, the Product Disclosure Statement (PDS), Financial Services Guide (FSG) and Target Market Determination (TMD) available from us. This insurance is underwritten by Pacific International Insurance Pty Ltd, ABN 83 169 311 193.